🐛 Attaching a Debugger
Because Miniflare is just a Node.js program, you can use regular Node.js tools to debug your workers. Setting breakpoints, watching values and inspecting the call stack are all examples of things you can do with a debugger.
If you're building your worker beforehand (e.g. with esbuild, Webpack, Rollup), make sure you're outputting 🗺 Source Maps before proceeding.
Visual Studio Code
Using npm Scripts
The easiest way to debug a worker is to create a launch configuration for an
npm script. As an example, if your package.json file contains a script that
invokes miniflare:
package.json{ ..., "scripts": { "dev": "miniflare worker.js --watch --debug" // no need to include --debug }, ...}...you should create a .vscode/launch.json file that contains the following:
.vscode/launch.json{ "configurations": [ { "name": "Miniflare (npm)", "type": "node", "request": "launch", "runtimeExecutable": "npm", "runtimeArgs": ["run", "dev"], // same script name as in package.json "skipFiles": ["<node_internals>/**"] } ]}From the Run and Debug menu in the activity bar, select the
Miniflare (npm) configuration, and click the green play button to start
debugging.
Using node
To debug without npm, you'll need to point Visual Studio Code at Miniflare's
executable. Create a .vscode/launch.json file that contains the following:
.vscode/launch.json{ "configurations": [ { "name": "Miniflare (node)", "type": "node", "request": "launch", "program": "${workspaceFolder}/node_modules/.bin/miniflare", "args": ["worker.js", "--watch", "--debug"], // no need to include --debug "skipFiles": ["<node_internals>/**"] } ]}WebStorm
Using npm Scripts
The easiest way to debug a worker is to have WebStorm automatically create a
configuration for an npm script. Open your package.json file, and click the
green play button in the gutter next to your script. Select the debug option to
start debugging.
Using node
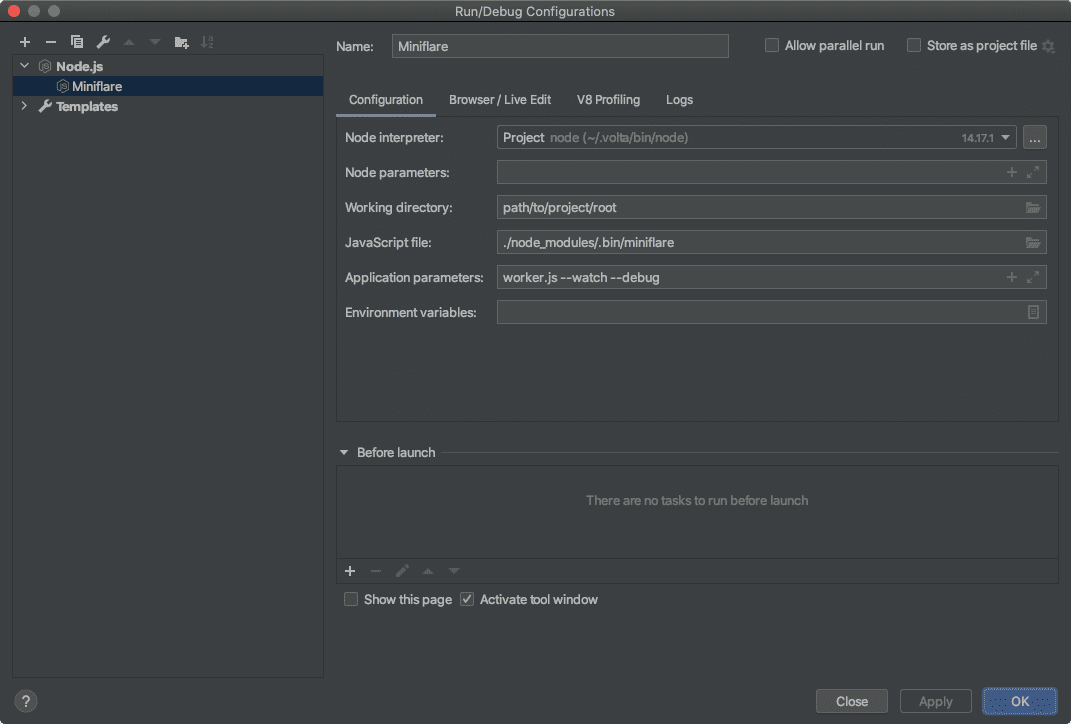
To debug without npm, you'll need to point WebStorm at Miniflare's executable.
Create a new configuration, by clicking Add Configuration in the top right.
Click the plus button in the top left of the popup and create a new
Node.js configuration. Set the JavaScript file field to
./node_modules/.bin/miniflare and add your Miniflare command line arguments to
the Application parameters field. Then click OK.
With the new configuration selected, click the green debug button to start debugging.
Node.js Inspector
Starting a Node.js application with the
--inspect flag
will listen for connections from a debugging client.
Unfortunately, 📚 Modules support currently requires the
--experimental-vm-modules flag. For cross-platform compatibility, Miniflare's
CLI actually spawns a new Node process with that flag set passing through other
command line arguments. This means starting the installed executable with the
--inspect flag would actually inspect the bootstrapper, not Miniflare itself.
To get around this, inspect the script the bootstrapper starts instead by
replacing miniflare with
node --experimental-vm-modules --inspect ./node_modules/miniflare/dist/src/cli.js:
$ node --experimental-vm-modules --inspect ./node_modules/miniflare/dist/src/cli.js worker.js --watch --debugNavigate to chrome://inspect in Google Chrome and click Open dedicated
DevTools for Node.
To add breakpoints, select the Sources tab, then the Filesystem sub-tab,
and click Add folder to workspace. Select your project's root directory.
Clicking on a project file will open it in DevTools. Clicking on a line number
in the gutter will toggle a breakpoint there. Alternatively, you can add
debugger; statements
to your code.


